Setting up Piwik (Matomo) analytics on Ubuntu + Nginx
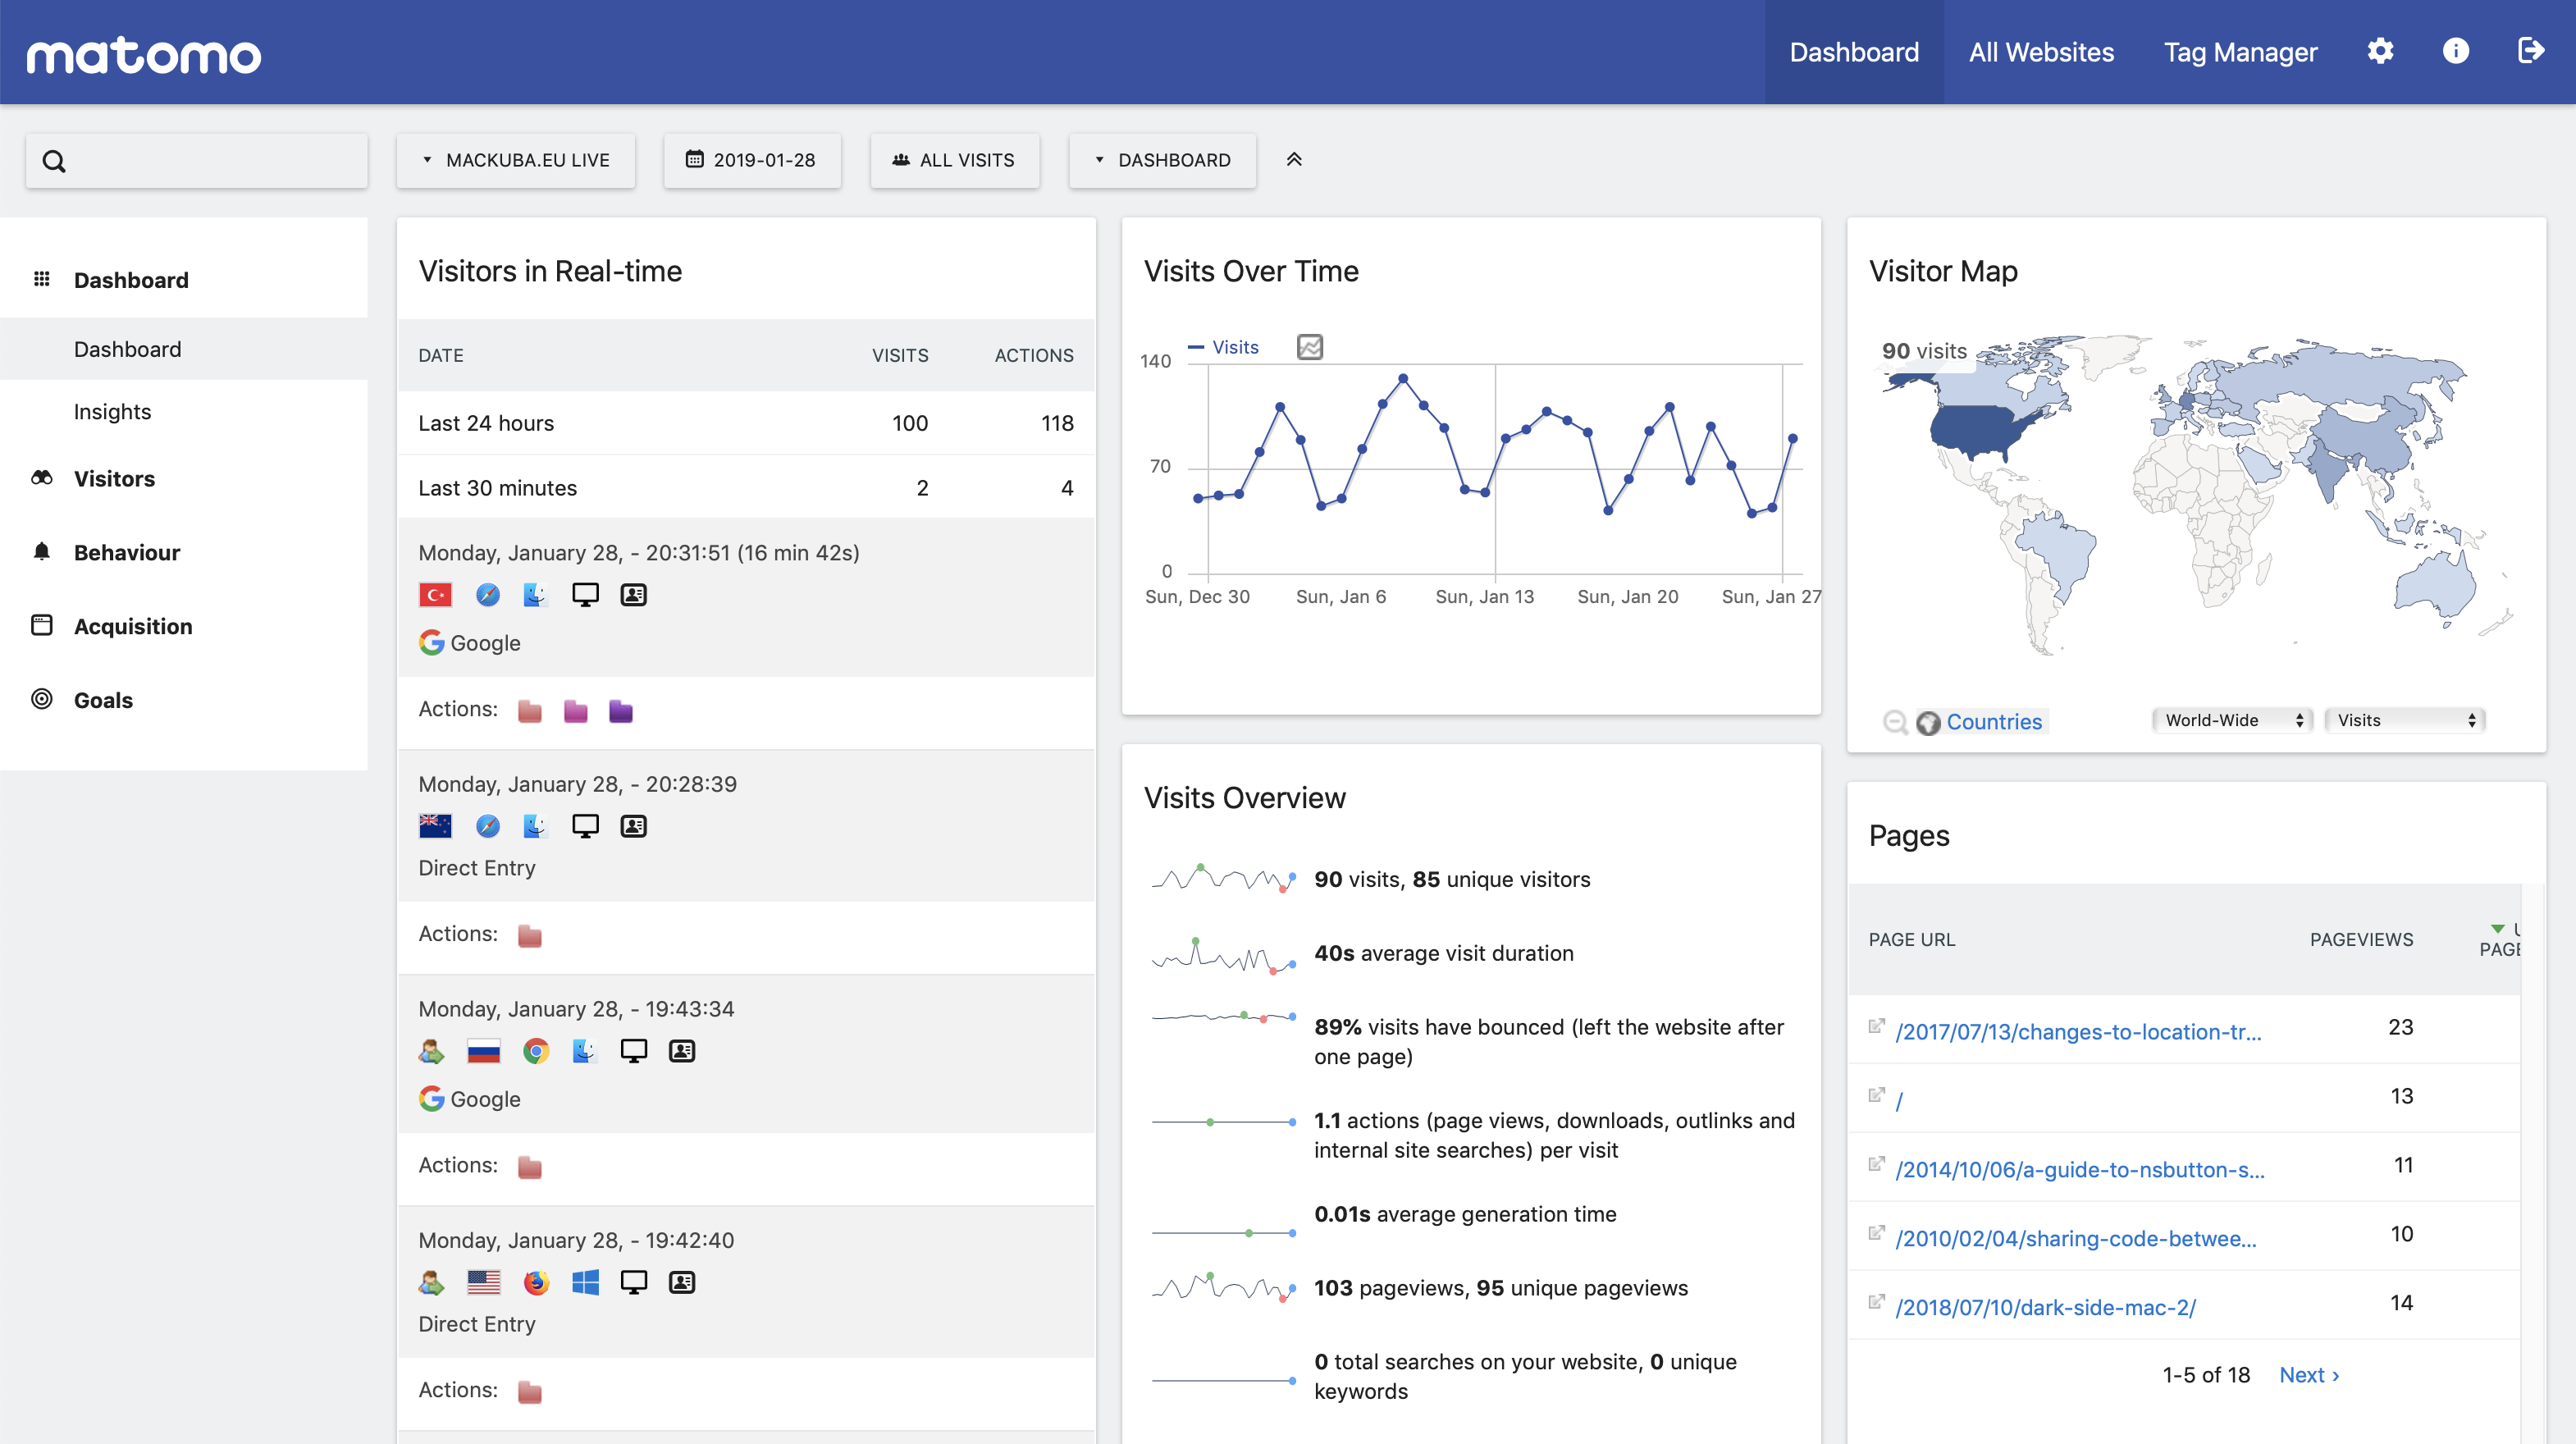
I’ve used several website analytics services over the years, including Statcounter, W3Counter, Clicky and Gauges (Google Analytics always seemed kind of too complicated and pro-focused for me). I don’t really need any complex functionality – just show me the number of visits in a given period, which pages were popular, what parts of the world people come from, what browsers/devices they use, and who links to me – so I was mostly satisfied with these products. The difference was mostly the friendliness and readability of the UI.
However, in the recent years, with the EU cookie law first and now GDPR, I started thinking about using something that allows me more control over the data and lets me avoid the dilemma of what kind of disclaimers I’m technically supposed to show on my site. Showing one of those idiotic “cookie banners” obviously isn’t an option since I’ve devoted so much time and energy fighting them, and I don’t think there’s a single person who actually wants to read them, but still, am I breaking some laws by not having one? I really don’t want to think about this.
I found Piwik (now Matomo), which is a self-hosted analytics service, a couple of years ago – but I didn’t have time to research it properly and set it up on my server until now. It eventually took much more time than I planned (and that I’d like to admit), partly because of my specific setup, partly just because of my own personal requirements and the perfectionist approach… So I wrote down all the steps just in case I need to come back to this again later, and I’m sharing it with the hope that it will save someone else some time.
Installation
I’ve been using Ansible for configuring this current server since the beginning. This has the advantage that I feel pretty confident that I know exactly what was done where and why, and that I can repeat it again at any time. On the other hand, each thing just takes much more time, since for each step I need to find the right Ansible command and options instead of just running a command following the instructions. I’ll try to list both versions for most steps here.
I’m also using a fairly old version of Ubuntu there – 14.04, which is the oldest currently supported LTS, which means some of the packages I need are in too old versions in the standard repository… So some changes might be needed on newer releases, but most things should probably work just fine.
PHP
The first step was installing PHP (yuck!) – most people may already have that set up, I didn’t. I think the last time I’ve configured PHP was with Apache, but now I’m using Nginx; its configuration is much simpler and easier to understand, but I think it’s still not as popular as Apache, at least in the PHP world, so guides are often written with Apache in mind first.
Of course I had to make sure I understand everything I’m writing, which means that in the process I’ve learned more about Nginx and PHP configuration that I ever wanted to 😉
My Ubuntu includes PHP 5 by default, but that’s a version originally released in 2004 (!). Piwik recommends PHP 7, which, as I understand, doesn’t introduce any essential new APIs, but is a rewrite that significantly improves performance. Besides, since last month PHP 5 doesn’t even get security updates anymore.
(Update 22.05.2019: I’ve now moved to Ubuntu 18.04 and this one doesn’t require the external repository for PHP – the standard repository includes PHP 7.2.)
I’ve installed PHP 7 from an external repository following this guide. First add the repository:
- name: "Add the PHP repository to apt"
  apt_repository:
    repo: ppa:ondrej/php
Or:
sudo apt-add-repository ppa:ondrej/php
sudo apt-get update
Then install all packages that Piwik suggests:
vars:
  php_version: "7.2"

...

- name: "Install PHP apt packages"
  apt:
    name:
    - php{{ php_version }}-cli
    - php{{ php_version }}-curl
    - php{{ php_version }}-fpm
    - php{{ php_version }}-gd
    - php{{ php_version }}-mbstring
    - php{{ php_version }}-mysql
    - php{{ php_version }}-xml
    - php-mysql
    - php-geoip
    state: latest
    update_cache: yes
    cache_valid_time: 3600
    install_recommends: no
At this point, you can test in the console if PHP works at all:
echo "<?php echo 2 + 2 ?> " | php
It should also automatically start the FPM service, which is how Nginx will be talking to PHP:
sudo service php7.2-fpm status
Now, to enable PHP use through the web server, we need to copy-paste a few magic commands to the Nginx config. We’ll test it on a temporary directory with a test script first (use Ansible’s copy command to upload a local config file to /etc/nginx/sites-available):
location ^~ /phptest {
  alias /var/www/phptest;
  index index.html index.htm index.php;

  location ~ \.php$ {
    include snippets/fastcgi-php.conf;

    fastcgi_param SCRIPT_FILENAME $request_filename;
    fastcgi_pass unix:/var/run/php/php7.2-fpm.sock;
  }
}
And put e.g. such file in /var/www/phptest/index.php:
2 + 2 = <?PHP echo 2 + 2 ?>
Try it in the web browser or with curl. If you get a generic 404 error page from Nginx (in error log: “2: No such file or directory”), it probably means it doesn’t even find the path properly. In my case, I had to use alias instead of root which I used initially, because otherwise the path prefix is appended to the root, which already included a /phptest.
If you get just a “File not found.” message in response (in error log: “FastCGI sent in stderr: "Primary script unknown” while reading response header from upstream"), it means Nginx is calling PHP, but it can’t figure out which script to run. I fixed it by adding the SCRIPT_FILENAME line, following this StackOverflow tip.
If the page renders correctly, you can move on to installing Piwik.
Installing Piwik
Piwik has been maintaining special packages for Debian/Ubuntu for a while in this repo. But I started playing with it at a bad moment, because a couple of months earlier the project had been renamed to “Matomo” for some weird reason (after building a somewhat recognizable brand for the previous 11 years), and the Debian packages needed some non-trivial amount of work to migrate to the new name. They weren’t ready at that point, so I had to wait a couple more months for this – but they are now available and they seem to work fine.
The repository’s readme includes simple instructions for installing the package manually. With Ansible, this is what I’ve done:
- name: "Load the Matomo apt repository key"
  apt_key:
    id: 1FD752571FE36FF23F78F91B81E2E78B66FED89E
    url: http://debian.matomo.org/repository.gpg

- name: "Add the Matomo repository to apt"
  apt_repository: repo="deb https://debian.matomo.org piwik main"

- name: "Install Matomo apt package"
  apt:
    name: matomo
    state: latest
    update_cache: yes
    cache_valid_time: 3600
    install_recommends: no

- name: "Enable automatic upgrades in debconf"
  debconf:
    name: matomo
    question: matomo/automatic-upgrade
    value: true
    vtype: boolean
During manual installation the package shows a window in the terminal asking if we want to migrate the database automatically whenever the package is updated to a new version. We won’t see that with automatic installation from a script, so I’ve used the debconf command here to manually set the flag that it would set normally (you can use sudo debconf-show matomo to confirm that it’s set correctly).
Creating a database
We’ll now create a separate MySQL user and a database for Piwik:
- name: "Create a database"
  mysql_db:
    name: piwik

- name: "Create a database user"
  mysql_user:
    user: piwik
    host: localhost
    priv: "piwik.*:SELECT,INSERT,UPDATE,DELETE,CREATE,DROP,ALTER,CREATE\ TEMPORARY\ TABLES,LOCK\ TABLES"
    password: "{{ lookup('password', 'passwords/' + ansible_hostname + '/piwik-db-user length=15') }}"
When installing manually, you can follow Piwik’s MySQL setup instructions.
Adding Piwik site to Nginx
Once we have that done, let’s replace that test site in Nginx with a real one:
location ^~ /piwik {
  alias /usr/share/matomo;
  index index.html index.htm index.php;

  access_log /var/log/nginx/piwik-access.log combined buffer=16k flush=10s;
  error_log /var/log/nginx/piwik-error.log;

  location ~ \.php$ {
    include snippets/fastcgi-php.conf;

    fastcgi_param SCRIPT_FILENAME $request_filename;
    fastcgi_pass unix:/var/run/php/php7.2-fpm.sock;
  }
}
Finishing the installation
Now try opening /piwik in your browser. If everything worked, you should see the installation’s welcome page. Follow the Installation Guide to complete the installation – fill in your database details (if you used the Ansible commands listed above, you’ll find the password in a piwik-db-user file in a passwords subdirectory) and your website info.
Choosing the method of collecting analytics
Piwik has several methods of collecting analytics, which are all later presented in the same way on the reports. The core service basically collects “hits”, which are single views or actions connected to a specific visitor with some parameters, but who sends those hits differs depending on your use case:
- you can use a standard JS script as in all hosted analytics services, in which case you copy-paste a snippet into your website’s layout; that script loads in each user’s browser and calls the PHP API
- the second way is to use something called log analytics, where you simply process your Apache/Nginx web server logs and send them to the PHP service (usually on the same machine)
- you can also use the service to collect statistics e.g. from mobile or desktop apps, in which case you call the web API remotely from the user’s device, either using one of the provided SDKs for your language/framework, or just making HTTP calls manually
For a website, the choice is between the first two approaches, and they both have some advantages and disadvantages.
👍 The advantages of JavaScript tracking over log analytics tracking are:
- much simpler setup – you just paste a snippet into your HTML and you’re done, with log analytics you need to set up some cron jobs and scripts to periodically process the data
- real-time data – visits tracked by JS appear on the reports instantly, with log analytics you usually only have them processed e.g. once an hour or daily (there is a way to send them from a web server to Piwik in real time, but it’s even more complicated)
- JavaScript can provide more info about the user’s system, e.g. the device’s screen resolution or language, which are not printed to the logs
- you can track visitors more precisely across visits, and use advanced functionality like e-commerce tracking where you can see how the people who bought your products found your site
- the logs include quite a lot of hits from robots, spammers and other attackers, which are kind of hard to filter out precisely and completely, so normally you tend to get higher numbers than you should
- with JS tracking you can also filter out your own visits by setting a special cookie in the settings – while in the logs, your requests are indistinguishable from everyone else’s
👎 However, JavaScript tracking also has some downsides:
- a significant percentage of web users (up to 30-50% in some countries) now use some kind of ad & tracker blockers (some browsers like Firefox or Brave have them built in), a lot of which also block any kind of analytics; so conversely to log analytics, you will in effect see much lower numbers than you had in reality. Based on my experiments, the number of visits “lost” due to JS blocking is probably much larger than the number of extra “fake” visits in the logs that aren’t filtered out.
- the number of tracked visitors is further decreased by the fact that the JS tracker by default doesn’t record the visit when the “Do Not Track” setting is enabled in the browser (which you can disable in the settings, but, well, should you?…).
- when you start, you usually already have some amount of Nginx logs, probably going a while back – so you can just process them all at once and you start with some analytics from an earlier period ready to analyze. With JS tracking, you only start collecting data from the point when you’ve added the snippet.
- the JS tracker keeps some amount of cookies, which, although they are only used within your system and not shared with anyone, still bring up some concerns about privacy policies and those damned cookie banners… You can disable storage of cookies in the preferences, although in that case you probably lose some precision and access to some advanced features.
So what to choose? 🤔
If you don’t want to spend too much time on this and don’t mind missing some 25-30% of the visits due to ad blockers, then I’d recommend to take the JS tracking route – it really is much simpler to set up. Create a new website entry, paste the snippet into your HTML, and that’s pretty much it. If you’re worried about privacy, GDPR and cookie laws, then disable cookies in the settings and make sure you’re anonymizing IPs and respecting Do Not Track; or conversely, if you want more accurate tracking, disable the Do Not Track support.
I went kind of back and forth on this and spent waay too much time doing some experiments, and in the end I settled on a sort of custom approach – I use log analytics, but with a few tricks added that greatly increase accuracy of the data (more on that later).
If you choose JS tracking, you can create the snippet in the Piwik settings, on the Websites / Tracking Code page. Paste it into your HTML, reload your site and then Piwik and you should see the first visit tracked immediately.
What is Archiving
When you read Piwik’s docs, pretty soon you’ll come across a concept called archiving. I will explain it here, because it took me a while to figure this out, so you’ll likely also be confused about this.
The data tracked by the JS tracker or sent from the log analyzing script is saved as visits data in the piwik_log_visit and piwik_log_link_visit_action tables. This data is only used directly in the “visitor log”. Everything else uses preprocessed data instead of running group queries on the visits table, which would be too slow.
The processed data is generated from the raw visits data, and it’s exactly what Piwik calls “archived data”. And the process of generating that data – which is displayed on all reports – from the raw data is what’s called “archiving”. So whenever you see “archive” or “archiving”, think “processed data” and “generating reports”.
Somewhat differently to what this word usually means (think: Gmail archive, Trello task archive), archiving here does not involve cleaning up any data or moving it to some less accessible place – on the contrary, it’s a required step to actually make the data accessible to you at all. No data is lost in the process, unless you configure it to be periodically deleted, but that’s unrelated to archiving.
And if you do want to have the data periodically deleted, e.g. for privacy reasons, you can configure cleaning up of both old raw visits data and old reports/archive data in the preferences. If you delete old archives, you lose old reports, and if you delete old visits data, you only lose the ability to see the visitor log for past days, which you normally won’t need – as long as you make sure the visits data was processed (archived) before it’s deleted! And before you enable the periodical deleting of data, check how much disk space is actually used by which table – the “DBStats” plugin (not enabled by default) can help you with that.
The docs will insist in many places that you need to set up a cron job to run archiving. But here’s an important detail: the archiving process is actually launched automatically on demand when needed, when you open the Piwik site and the data isn’t ready. It can just take a while if you have a lot of data to process, so it’s better to preprocess it so that you don’t have to watch a spinner on the site.
But it all depends on how much traffic you have on your website. If you don’t have much to process, you can just open Piwik whenever you want to look at reports and never worry about archiving. However, if you see that you have to wait a long time every time you open your Piwik website, then definitely do set up a cron job that runs archiving in the background.
I had some cases where Piwik got confused when I added new data and wasn’t updating the reports for some reason, so I ended up adding the archiving job anyway – it doesn’t take more than a few seconds to finish processing when run regularly.
Enabling Geolocation
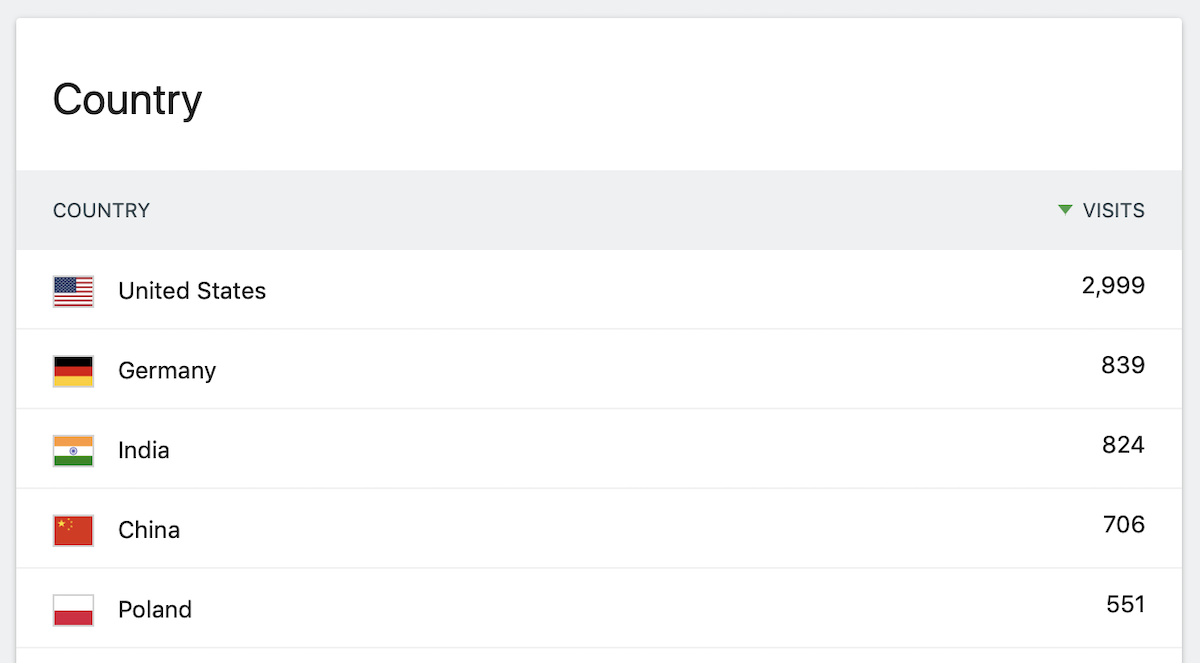
In order to see where your visitors come from, you need access to some kind of database that roughly maps IP ranges to countries and regions (which is never 100% exact, but for our use case it’s not a problem – we’re not one of those evil people who use such data to block access to users from selected countries… 👿). You need this regardless if you use JS tracking or log analytics.
Such database is distributed by a company called MaxMind, and is made available for free (they make money on a more precise, paid version). But you need to download it first, if you want to use it on your server.
MaxMind provides a geoipupdate tool which can be used to update the database periodically, which we’ll install here from their repository:
- name: "Add the MaxMind repository for geoip tools"
  apt_repository:
    repo: ppa:maxmind/ppa

- name: "Install geoip packages"
  apt:
    name: geoipupdate
    state: latest
    update_cache: yes
    cache_valid_time: 3600
    install_recommends: no
Or manually:
sudo apt-add-repository ppa:maxmind/ppa
sudo apt-get update
sudo apt-get install geoipupdate
I’ve edited the config to also enable a third database apart from “Country” and “City”, which is used to guess the ISP network the user is connected to (don’t worry, it’s pretty small). This is visible on the “Providers” report in the Piwik UI – however, you need to go into the preferences and enable the “Provider” plugin on the plugins page first to see that.
- name: "Configure geoip to also use the ASN database"
  lineinfile:
    dest: /etc/GeoIP.conf
    regexp: "^EditionIDs"
    line: "EditionIDs GeoLite2-Country GeoLite2-City GeoLite2-ASN"
Now, we run the geoipupdate command to download all the databases (only if they weren’t downloaded yet):
- name: "Update geoip database"
  command: geoipupdate -d /usr/share/matomo/misc/
  args:
    creates: /usr/share/matomo/misc/GeoLite2-City.mmdb
We’ll also want to set up a cron job to update the databases once a month (new versions are released on the first Tuesday of each month):
- name: "Set up a cron job for updating geoip"
  cron:
    user: root
    name: "Update geoip database"
    day: 8
    hour: 3
    minute: 30
    job: "geoipupdate -d /usr/share/matomo/misc/"
Or:
30 3 8 * * geoipupdate -d /usr/share/matomo/misc/
Also, make sure you have geolocation enabled in the settings – I don’t rememeber what the default is, but you should choose the option “GeoIP 2 (Php)” in System / Geolocation.
Using log analytics
If you chose JS tracking, you can basically stop reading here. Otherwise, let’s get the log analytics set up now.
The way you feed logs to the core service is by running an import_logs.py script (yes, in Python), passing it the URL of the web API and usually also the numeric ID of the configured website. You can find the numeric ID in the admin panel, in the table on the Websites > Manage page, or when you look at the idSite parameter in the URL when you open a website from the All Websites list.
python /usr/share/matomo/misc/log-analytics/import_logs.py --idsite=1 \
  --url=https://yoursite.com/piwik /var/log/nginx/yoursite-access.log
You will probably need to add sudo -u www-data to that, otherwise you’ll get an error about either tmp directory not being writable (“PHP Fatal error: Uncaught InvalidArgumentException”), or the log file not being readable.
If you get an error like this:
HTTP Error 413: Request Entity Too Large
Then you might need to configure the script to pass fewer records in one batch:
sudo -u www-data python /usr/share/matomo/misc/log-analytics/import_logs.py \
  --idsite=1 --url=https://yoursite.com/piwik --recorder-max-payload-size=50 \
  /var/log/nginx/yoursite-access.log
But first, check your Nginx/Apache config – your server configuration may be limiting the max allowed request body size (in case of Nginx it’s client_max_body_size).
Try it all on a small log at first, not the complete data from all the logs you have. If it goes through, open the Piwik site and look at the reports. You should see most of the visitor and content stats for the given period as you’d expect.
If you run the script again, the data will get duplicated – you won’t see more visits, because the number of unique IPs will stay the same, but all the action counts will double. In order to clean up data and start from scratch, you need to get in the MySQL console and delete data from some tables:
matomo_archive_blob_YYYY_MMandmatomo_archive_numeric_YYYY_MMwhich contain “archived data” (reports) for a given monthmatomo_log_visitandmatomo_log_link_visit_actionwhich store visit data
So, for example:
DELETE FROM piwik_archive_blob_2019_01 WHERE idsite = 1;
DELETE FROM piwik_archive_numeric_2019_01 WHERE idsite = 1;
DELETE FROM piwik_log_visit WHERE idsite = 1;
DELETE FROM piwik_log_link_visit_action WHERE idsite = 1;
If you have reports spanning more than one month, you’ll have to repeat the first two lines for each month. You can use TRUNCATE TABLE ... instead if you only have one site.
The import_logs.py script has a lot of additional options, which you can look through if you want, but most aren’t really necessary. You can for example enable counting bots, static resource loads and HTTP errors as normal hits, but this makes it pretty hard to filter out the real numbers in the UI later.
The options you might be interested in are:
--exclude-pathwhich lets you completely exclude requests made to some parts of the site (e.g. to the Piwik UI, if you have it set up in such a way that it logs to the same log)--useragent-excludewhich lets you exclude some additional groups of user agents that the script doesn’t recognize as bots
Both options can be listed many times to exclude multiple paths/browsers.
Skipping previously recorded visits
One of the unsolved problems of the log analytics tracker is how to continuously parse the same log file, but ignoring the visits we’ve already parsed. Remember what I wrote above, that if you run the script again, you will get double the number of actions? But the Nginx access logs are usually only rotated once a week, and you will probably want to see the data sooner than with a week long delay…
The usually recommended approach is to meet somewhere in the middle: make the server rotate the logs more often, but maybe not too often, and accept that there will be some delay before you see data in the reports.
What I’ve decided to do instead is to track the timestamp of the latest parsed log entry, and then skip all entries up to this date when parsing the log again. I’ve initially used a Ruby script and the built-in --exclude-older-than option in import_logs.py, but in the end I forked the matomo-log-analytics repository and added support for such filtering into the script itself. I’m doing it by keeping a timestamp file in a new directory /var/lib/matomo/data/timestamps, and then passing a new --timestamp-file=... option to the import script.
So the whole thing can be wrapped in a separate log-import script, which first calls the actual import script and then the archive command:
python /usr/share/matomo/misc/log-analytics/import_logs.py \
  --idsite=1 --url=https://yoursite.com/piwik --recorder-max-payload-size=50 \
  --timestamp-file=/var/lib/matomo/data/timestamps/yoursite.time \
  /var/log/nginx/yoursite-access.log

/usr/share/matomo/console core:archive --force-idsites=1
Which can then be run from cron e.g. every hour:
- name: "Set up a cron job to run log analytics"
  cron:
    user: root
    name: "Run Piwik log analytics"
    minute: 1
    job: "sudo -u www-data log-import >> /var/log/matomo/log-import.log"
Or:
1 * * * * sudo -u www-data log-import >> /var/log/matomo/log-import.log
Extra tweaks and hacks
We’re now heading deep into the OCD territory, so if you’re a normal person and just want to get this thing done and move on to something more productive, and you don’t need to have everything working absolutely perfectly, this is the moment where you can silently walk out of the room and leave…
Ignoring bots
If you look into your log files, you might discover that actually the vast majority of the requests come from various bots, services, people trying to log in to your WordPress for some reason (even though you don’t have a WordPress), and so on… Fortunately, most of them are caught either in the import_logs.py script or in the core service, but some aren’t – enough that it was noticeable in the numbers.
And again, I’ve spent way too much time playing with this and testing different approaches, until I found one that was surprisingly simple and worked almost perfectly: ignore everyone who never loads any JavaScript file. The big search engine bots that do download JavaScript are already filtered out by Piwik, and all the smaller random bots that were adding noise to my stats – RSS services, Mastodon instances, various “monitors”, “validators” and “scanners” – almost always just make single HTTP requests to given pages, skipping any assets (since this would slow them down and they usually don’t need them). Or they might download images and maybe CSS, but usually not JavaScript.
This does exclude people who have JavaScript turned off in their browsers completely, but let’s face it, how many people do that these days?…
So in the end I wrote a small Ruby script that basically reads a day’s worth of logs, then finds which IPs have downloaded at least one .js file during that day, and ignores all IPs that didn’t (note: this only really works well if at least one JavaScript on your site is not cached, otherwise you might lose some repeated visits when the JavaScript is loaded from the browser cache). Then I pipe the Nginx log through that script and pass the output to import_logs.py.
It works much much better than both the JS tracker and an external tracking service I compared it with: they were missing somewhere between ⅓ and ¼ of the entries I got from the logs, and almost all of those entries looked completely legit when I checked them. The JS trackers also sometimes added some entries which did not appear in the logs, at least not in this period – I assume in those cases someone’s browser just somehow reloads the scripts on a page they’ve opened before, but the HTML is cached and not redownloaded, or maybe they open some locally downloaded copy.
Adding page titles
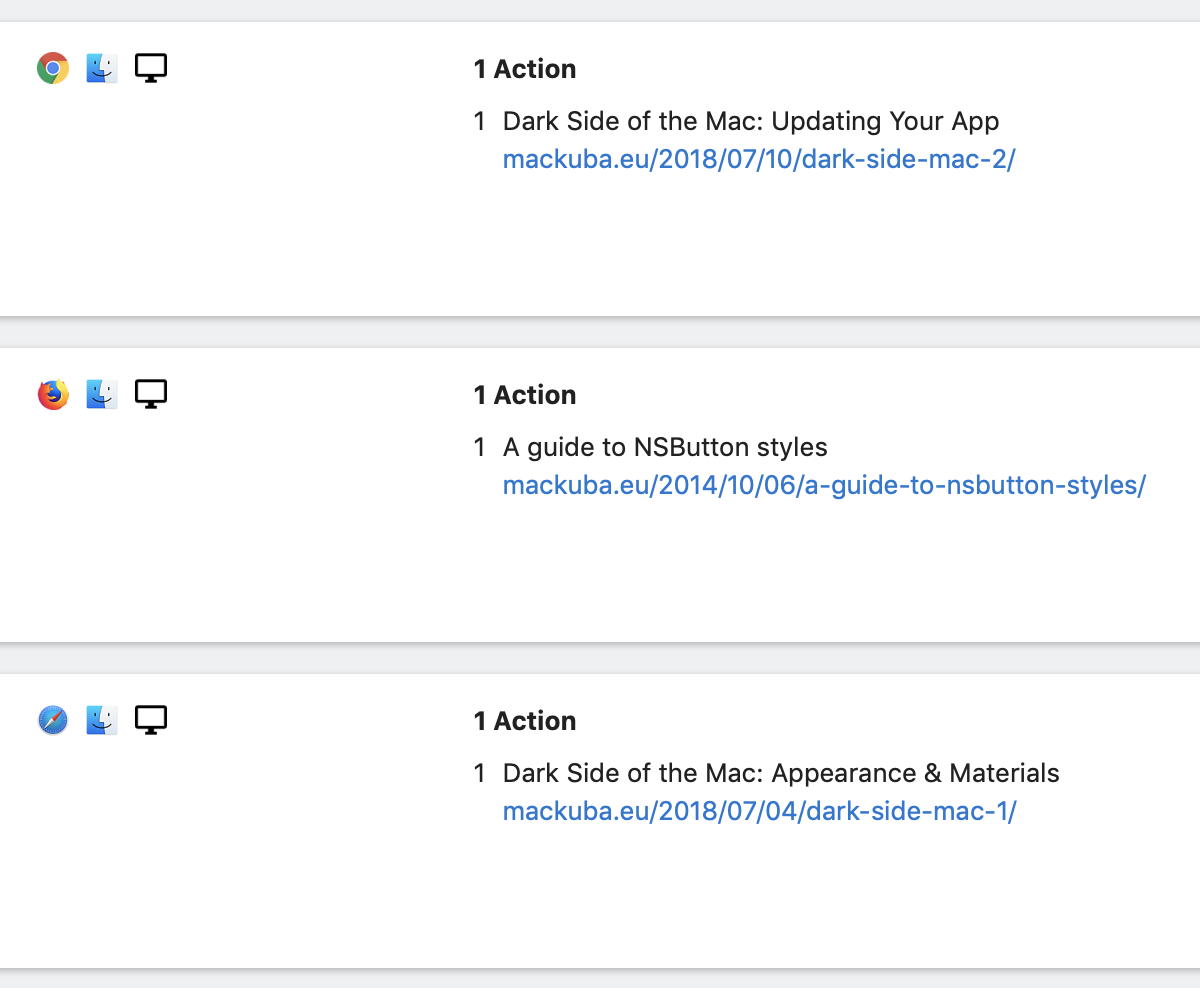
There is a report page named “Page Titles” that lists the titles of pages instead of URLs (e.g. “Dark Side of the Mac: Updating Your App” vs. “/2018/07/10/dark-side-mac-2/”); the same page titles are also displayed in the visitor log. However, the titles are read by JavaScript from the <title> tag in the page header, so they don’t appear in the logs, and for log analytics sites this report is empty.
So I had an idea that I can provide a static file with a mapping of URL => title, since it doesn’t change that often, and then add a new feature to my fork of the import script that makes it look up titles in that file when parsing the log. The file can be generated in various ways – e.g. if you have an XML sitemap, you can download it and then iterate through all URLs and save their titles. You can also do as I’ve done now and generate the page titles file from inside your blog engine or static site generator, since it usually has the full list of pages/articles in some kind of database or config file.
I’ve set it up so that the file is regenerated during a deploy, and then the import script can read it every time it processes the logs. And now I have page titles listed everywhere just like with a JS tracker.
Cleaning up referers
You know how a lot of URLs you open from some social media have some kind of garbage parameters added, like utm_something or the fbclid that Facebook started adding to everything recently? Piwik removes most of those from your URLs automatically (you can add more in the settings if it misses something), however it doesn’t do that with referer URLs. So you end up having the links on the referer report split somehow – you get e.g. 10 hits from http://medium.com/foo/bar, but then 5 more from 5 different URLs like http://medium.com/foo/bar?fclid=jdfhgksjhfgksjhdfgsdflkjh, which are really the same URL as the first one.
So I’ve made another change in my fork of the import script to clean up those from the referer links. It doesn’t cover everything, but almost all of those parameters fall into one of the two groups I mentioned.
Tracking page render time
When you use the JS tracker, Piwik shows you average page render time for each page or URL (the last column in the table). It can also do that with logs, but the numbers need to be written there, and by default they aren’t. You can change this by defining a new log format in Nginx config, which is the same as the default “combined” format, just with one extra field $request_time added at the end (do this in the main http section):
log_format full_with_duration '$remote_addr - $remote_user [$time_local] '
                              '"$request" $status $body_bytes_sent '
                              '"$http_referer" "$http_user_agent" $request_time';
Then, each time you define a log file for some section of your site, tell it to use this new format:
access_log /var/log/nginx/access.log full_with_duration buffer=16k flush=10s;
And now you have to tell the import_logs.py script how to parse this custom format (note the generation_time_secs at the end):
export FORMAT_REGEX='(?P<ip>[\w*.:-]+)\s+\S+\s+(?P<userid>\S+)\s+\[(?P<date>.*?)\s+(?P<timezone>.*?)\]\s+"(?P<method>\S+)\s+(?P<path>.*?)\s+\S+"\s+(?P<status>\d+)\s+(?P<length>\S+)\s+"(?P<referrer>.*?)"\s+"(?P<user_agent>.*?)"\s*(?P<generation_time_secs>[.\d]*)'

sudo -u www-data python /usr/share/matomo/misc/log-analytics/import_logs.py --idsite=1 \
  --url=https://yoursite.com/piwik --recorder-max-payload-size=50 \
  --log-format-regex="$FORMAT_REGEX" /var/log/nginx/yoursite-access.log
Random stuff
A few last random tips that don’t fit anywhere else:
- remember to enable the Provider plugin if you want to see geolocated ISPs info
- the DBStats plugin can show you how much space the database uses
- remember to set up a backup for your Piwik database :)
- put the whole Piwik site on an HTTPS address, if possible, and set up automatic redirect from HTTP either in Nginx or in Piwik’s
config.ini.php - also in the
config.ini.php, you can override thelive_widget_refresh_after_secondsoption in the[General]section to stop it from trying to load live data every 5 seconds by default, since you will only have new data once an hour anyway – set it to e.g. 60 - you might want to add Facebook’s
fbclidparameter to “Global list of Query URL parameters to exclude” in Websites / Settings, since I think it’s not excluded automatically yet